问题描述
假如现在有一组矩形框,已知每个矩形四个顶点的坐标,这些矩形有些是挨一起的,有些离得比较远,现在需要解决的问题是,将那些明显 “不合群” 的矩形找出来。
已知的示例数据如下,每一行是一个矩形的四个顶点坐标,格式为 x1 y1 x2 y2 x3 y3 x4 y4,下面是 100 个矩形的测试数据:
904.00 41.00 904.00 61.00 869.00 61.00 869.00 41.00
103.00 35.00 103.00 67.00 62.00 67.00 62.00 35.00
598.11 23.05 597.95 69.05 285.89 67.95 286.05 21.95
682.00 23.00 682.00 70.00 602.00 70.00 602.00 23.00
612.00 66.00 612.00 96.00 350.00 96.00 350.00 66.00
328.03 65.04 327.90 28.03 629.97 26.96 630.10 63.97
325.93 92.97 326.03 64.97 633.07 66.03 632.97 94.03
329.03 65.04 328.90 28.03 629.97 26.96 630.10 63.97
325.93 92.97 326.03 64.97 634.07 66.03 633.97 94.03
568.00 28.00 568.00 64.00 203.00 64.00 203.00 28.00
759.03 67.02 758.98 94.02 199.97 92.98 200.02 65.98
756.00 26.00 756.00 66.00 550.00 66.00 550.00 26.00
553.14 66.13 552.72 29.14 755.86 26.87 756.28 63.86
759.03 67.02 758.98 94.02 199.97 92.98 200.02 65.98
568.00 28.00 568.00 64.00 203.00 64.00 203.00 28.00
533.00 26.00 533.00 68.00 424.00 68.00 424.00 26.00
520.00 66.00 520.00 94.00 439.00 94.00 439.00 66.00
567.00 25.00 567.00 68.00 393.00 68.00 393.00 25.00
533.00 67.00 533.00 95.00 427.00 95.00 427.00 67.00
664.00 25.00 664.00 65.00 296.00 65.00 296.00 25.00
228.02 95.02 227.96 67.02 727.98 65.98 728.04 93.98
297.08 68.08 296.84 28.08 663.92 25.92 664.16 65.92
729.00 65.00 729.00 95.00 227.00 95.00 227.00 65.00
84.00 40.00 84.00 55.00 64.00 55.00 64.00 40.00
395.08 67.08 394.83 27.08 576.92 25.92 577.17 65.92
394.05 95.05 393.89 67.06 576.95 65.95 577.11 93.94
393.08 66.07 392.84 29.08 575.92 27.93 576.16 64.92
577.00 67.00 577.00 95.00 395.00 95.00 395.00 67.00
700.00 24.00 700.00 66.00 261.00 66.00 261.00 24.00
331.06 95.06 330.87 68.07 628.94 65.94 629.13 92.93
260.03 67.03 259.93 25.03 699.97 23.97 700.07 65.97
105.00 30.00 105.00 69.00 54.00 69.00 54.00 30.00
631.00 65.00 631.00 95.00 329.00 95.00 329.00 65.00
630.00 65.00 630.00 95.00 329.00 95.00 329.00 65.00
700.00 24.00 700.00 67.00 260.00 67.00 260.00 24.00
136.00 15.00 136.00 77.00 42.00 77.00 42.00 15.00
270.02 93.02 269.96 68.02 688.98 66.98 689.04 91.98
666.00 27.00 666.00 66.00 294.00 66.00 294.00 27.00
97.00 28.00 97.00 45.00 68.00 45.00 68.00 28.00
271.02 93.02 270.96 68.02 688.98 66.98 689.04 91.98
665.07 29.03 664.97 65.03 294.93 63.97 295.03 27.97
345.03 65.05 344.88 28.03 613.97 26.95 614.12 63.97
571.00 68.00 571.00 92.00 390.00 92.00 390.00 68.00
507.00 29.00 507.00 63.00 238.00 63.00 238.00 29.00
724.00 29.00 724.00 63.00 522.00 63.00 522.00 29.00
685.00 68.00 685.00 92.00 272.00 92.00 272.00 68.00
508.00 29.00 508.00 63.00 238.00 63.00 238.00 29.00
725.14 28.07 724.93 65.07 517.86 63.93 518.07 26.93
685.00 68.00 685.00 92.00 272.00 92.00 272.00 68.00
685.00 68.00 685.00 92.00 272.00 92.00 272.00 68.00
508.00 29.00 508.00 63.00 238.00 63.00 238.00 29.00
725.00 28.00 725.00 65.00 518.00 65.00 518.00 28.00
665.00 28.00 665.00 64.00 296.00 64.00 296.00 28.00
650.06 66.03 649.97 96.00 308.94 94.97 309.03 64.97
329.03 65.04 328.90 28.03 626.97 26.96 627.10 63.97
624.00 67.00 624.00 94.00 335.00 94.00 335.00 67.00
92.00 40.00 92.00 61.00 64.00 61.00 64.00 40.00
624.00 67.00 624.00 94.00 335.00 94.00 335.00 67.00
329.03 65.04 328.90 28.03 626.97 26.96 627.10 63.97
93.00 37.00 93.00 62.00 61.00 62.00 61.00 37.00
651.05 67.03 650.97 94.03 305.95 92.97 306.03 65.97
218.06 68.06 217.89 26.06 741.94 23.94 742.11 65.94
528.00 27.00 528.00 64.00 220.00 64.00 220.00 27.00
652.00 65.00 652.00 95.00 305.00 95.00 305.00 65.00
742.00 25.00 742.00 65.00 533.00 65.00 533.00 25.00
347.07 67.10 346.76 30.07 611.93 27.90 612.24 64.93
599.00 67.00 599.00 94.00 361.00 94.00 361.00 67.00
501.00 27.00 501.00 70.00 457.00 70.00 457.00 27.00
502.00 69.00 502.00 92.00 456.00 92.00 456.00 69.00
228.03 67.03 227.94 25.03 732.97 23.97 733.06 65.97
645.00 67.00 645.00 94.00 315.00 94.00 315.00 67.00
861.00 38.00 861.00 56.00 835.00 56.00 835.00 38.00
501.00 28.00 501.00 70.00 459.00 70.00 459.00 28.00
502.00 69.00 502.00 92.00 456.00 92.00 456.00 69.00
855.00 33.00 855.00 43.00 841.00 43.00 841.00 33.00
237.03 69.03 236.93 24.03 719.97 22.97 720.07 67.97
296.90 90.95 297.05 68.95 607.10 71.05 606.95 93.05
661.00 74.00 661.00 89.00 605.00 89.00 605.00 74.00
720.00 23.00 720.00 69.00 238.00 69.00 238.00 23.00
604.16 71.08 603.92 95.08 295.84 91.92 296.08 67.92
661.00 74.00 661.00 89.00 605.00 89.00 605.00 74.00
330.05 67.09 329.79 30.06 630.95 27.91 631.21 64.94
348.94 90.97 349.03 68.97 613.06 70.03 612.97 92.03
330.05 65.08 329.81 31.05 627.95 28.92 628.19 62.95
588.08 69.04 587.96 94.04 370.92 92.96 371.04 67.96
639.00 30.00 639.00 63.00 321.00 63.00 321.00 30.00
634.00 68.00 634.00 92.00 325.00 92.00 325.00 68.00
319.08 66.08 318.84 30.08 638.92 27.92 639.16 63.92
635.00 68.00 635.00 92.00 325.00 92.00 325.00 68.00
284.04 66.04 283.93 26.04 672.96 24.96 673.07 64.96
628.06 68.03 627.97 95.03 332.94 93.97 333.03 66.97
402.08 65.13 401.68 31.09 671.92 27.87 672.32 61.91
626.06 69.03 625.97 93.03 333.94 91.97 334.03 67.97
399.00 27.00 399.00 65.00 285.00 65.00 285.00 27.00
399.00 41.00 399.00 53.00 385.00 53.00 385.00 41.00
668.00 68.00 668.00 92.00 291.00 92.00 291.00 68.00
470.07 65.10 469.75 31.08 703.93 28.90 704.25 62.92
456.00 30.00 456.00 64.00 252.00 64.00 252.00 30.00
708.00 26.00 708.00 65.00 251.00 65.00 251.00 26.00
668.00 68.00 668.00 92.00 291.00 92.00 291.00 68.00
我们在同一平面上,把矩形画出来,看起来是这个样子:
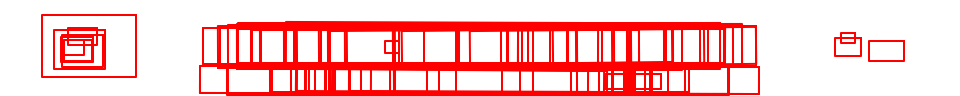
从上图可以比较直观地看到,绝大部分矩形都分布在靠中间的位置,重叠在一起,左边和右边有少数几个偏得比较远的矩形。现在就是需要找到一个异常值剔除算法,将左右这两组异常的矩形找出来。
DBSCAN 算法
这个问题可以采用聚类算法来解决,最简单的聚类像是 K-Means 这种,我们在聚类的同时,需要找到没办法聚到一起的异常值,K-Means 做不到这一点,而基于密度的聚类算法 DBSCAN 可以在聚好类的同时,将噪声值也输出,恰好可以解决我们的场景。
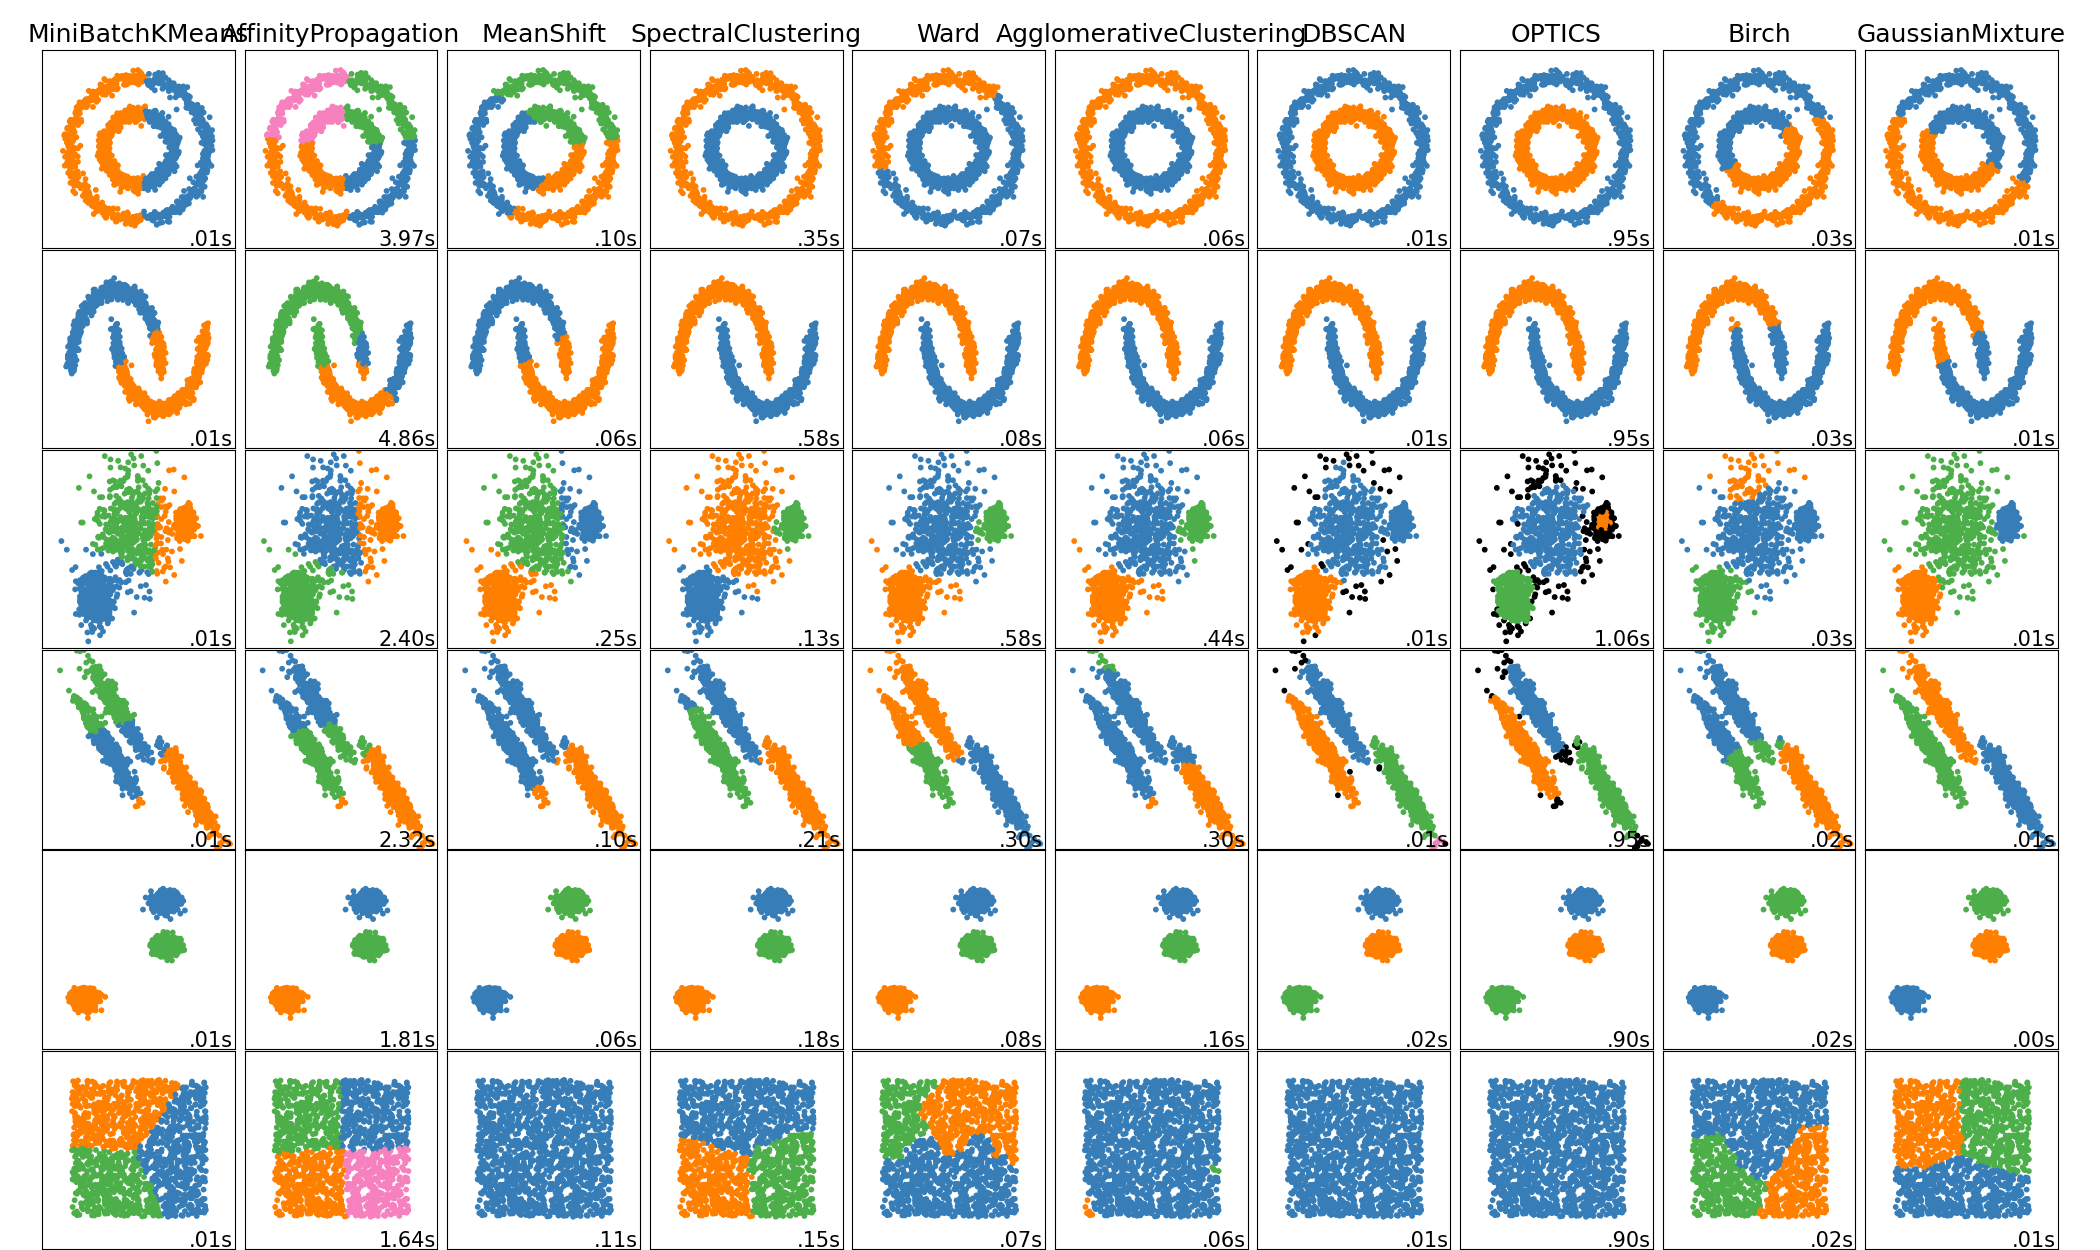
下图是不同聚类算法效果和性能,来源自 scikit-learn 网站:
DBSCAN 算法有两个参数,eps 和 minPts,算法步骤大概如下:
- 计算数据集中每两个数据间的距离,将算好的值保存好待查。
- 对数据集中的数据遍历:
- 找当前点 eps 距离范围内有多少个数据,如果 >= minPts 个数据,则认为是一个聚类。如果 < minPts,则把点标记成噪声点。将当前点标记为访问过。
- 对上步的在 eps 范围内的点,再遍历他们,计算他们 eps 范围内有多少个数据,如果 >= minPts 个,则把这些点也加入到当前聚类中。并把计算过的点,标记为访问过。
- 如果当前点已经被访问过了,就跳过。
DBSCAN 算法的伪代码可以写成:
DBSCAN(D, eps, MinPts) {
   C = 0
   for each point P in dataset D {
      if P is visited
         continue next point
      mark P as visited
      NeighborPts = regionQuery(P, eps)
      if sizeof(NeighborPts) < MinPts
         mark P as NOISE
      else {
         C = next cluster
         expandCluster(P, NeighborPts, C, eps, MinPts)
      }
   }
}

expandCluster(P, NeighborPts, C, eps, MinPts) {
   add P to cluster C
   for each point P' in NeighborPts {
      if P' is not visited {
         mark P' as visited
         NeighborPts' = regionQuery(P', eps)
         if sizeof(NeighborPts') >= MinPts
            NeighborPts = NeighborPts joined with NeighborPts'
      }
      if P' is not yet member of any cluster
         add P' to cluster C
   }
}

regionQuery(P, eps)
   return all points within P's eps-neighborhood (including P)
这里有一个非常棒的算法原理演示:https://www.naftaliharris.com/blog/visualizing-dbscan-clustering/
要实现聚类算法,第一步就是要确定我们的数据集中,如何计算两个数据之间的距离。如果数据是单个值,则距离是两个值相减的绝对值,如果数据是二维点,则距离是两点间的欧氏距离,这两种情况都比较好办。但问题是我们的数据集是矩形,所以第一步我们需要能够计算两个矩形之间的距离值。
矩形之间距离
我们定义两个矩形间的距离为:
- 如果两个矩形有交叉,则距离为 0。
- 矩形 1 的四个顶点到矩形 2 的最短距离为 d1,反之,矩形 2 的顶点到矩形 1 最短为 d2。
- d1 和 d2 两个值,最小的就是我们要的矩形间距离值。
矩形交叉计算
对于上面的第 1 步,可以分别计算两个矩形间的 4 条边,是否有交叉,如果有,则矩形就有交叉。
两条线段之间是否交叉,可以直接利用数学公式来判断,对于线段 (x1, y1) – (x2, y2),和线段 (x3, y3) – (x4, y4),按照如下公式计算值 t 和 u:
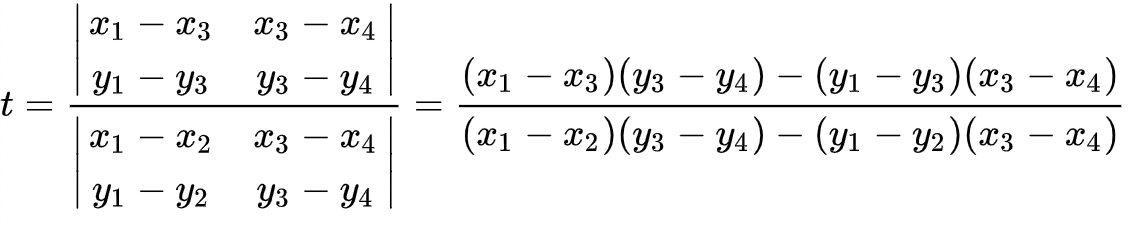
注意计算的时候,需要判断特殊情况,就是两线段平行的时候,也就是上面公式中分母为 0 的情况。
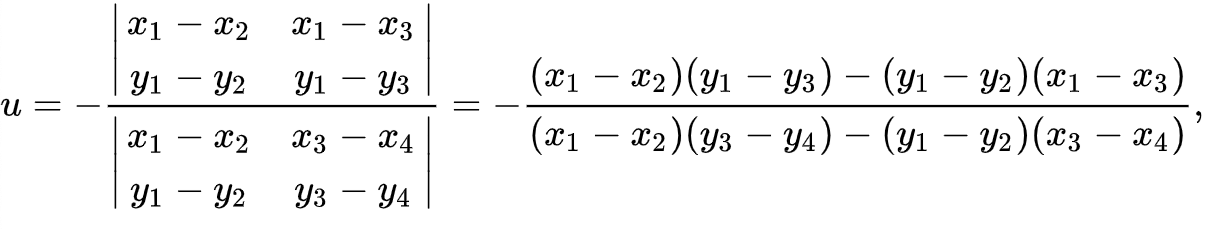
如果计算出来的 0.0 ≤ t ≤ 1.0 ,并且 0.0 ≤ u ≤ 1.0 时,两线段相交,否则不相交。
判断两线段是否相交的 Go 语言代码如下:
// IsLineSegmentIntersect 判断两条线段是否相交,线段1 (p1, p2),线段2 (p3, p4)
func IsLineSegmentIntersect(p1, p2, p3, p4 []float64) bool {
    m := (p1[0]-p2[0])*(p3[1]-p4[1]) - (p1[1]-p2[1])*(p3[0]-p4[0])
    if m == 0 {
        return false
    }
    t := ((p1[0]-p3[0])*(p3[1]-p4[1]) - (p1[1]-p3[1])*(p3[0]-p4[0])) / m
    if t > 1 || t < 0 {
        return false
    }
    u := -((p1[0]-p2[0])*(p1[1]-p3[1]) - (p1[1]-p2[1])*(p1[0]-p3[0])) / m
    if u > 1 || u < 0 {
        return false
    }
    return true
}
点到矩形的距离
对于上面的第 2 步,需要计算一个点到矩形的距离,可以分别先计算这个点到矩形 4 条边的距离,再取最小值。
这又涉及到如何计算一个点到一条线段间的距离,分两种情况。
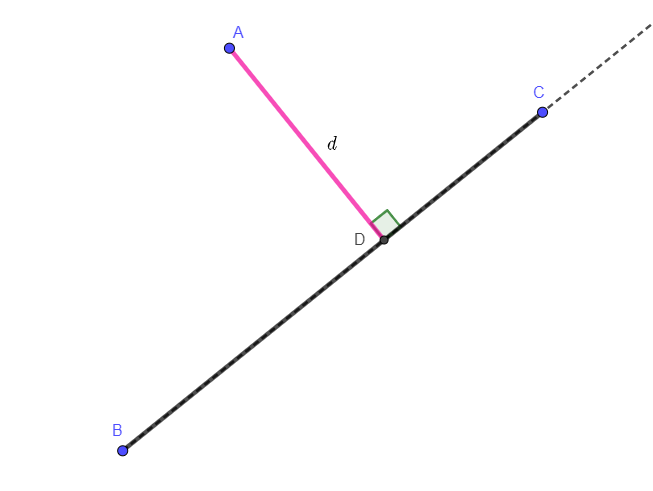
第一种情况是,点到线段的垂足,落在线段中间,如下图,垂足点 D 在线段 AC 上面,这时距离值取 d = AD 。
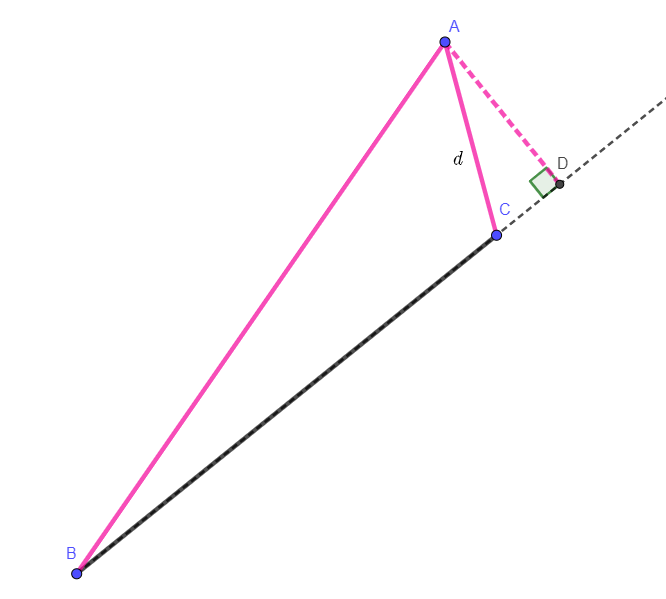
第二种情况是,点到线段的垂足,落在了线段外面,如下图,则距离值取 𝑑 = min(𝐴𝐵, 𝐴𝐶)。
我在网上找到了一段代码,用于计算点到线段的距离,c++ 语言版本的:
float minimum_distance(vec2 v, vec2 w, vec2 p) {
  // Return minimum distance between line segment vw and point p
  const float l2 = length_squared(v, w);  // i.e. |w-v|^2 -  avoid a sqrt
  if (l2 == 0.0) return distance(p, v);   // v == w case
  // Consider the line extending the segment, parameterized as v + t (w - v).
  // We find projection of point p onto the line.
  // It falls where t = [(p-v) . (w-v)] / |w-v|^2
  // We clamp t from [0,1] to handle points outside the segment vw.
  const float t = max(0, min(1, dot(p - v, w - v) / l2));
  const vec2 projection = v + t * (w - v);  // Projection falls on the segment
  return distance(p, projection);
}
我把它改造成 Go 语言版本:
// dist2 计算两点 v、w 的距离平方,不做 sqrt 操作
func dist2(v, w []float64) float64 {
    return (v[0]-w[0])*(v[0]-w[0]) + (v[1]-w[1])*(v[1]-w[1])
}

// MinDistanceSqrBetweenPointAndLineSegment 计算点 p0,到线段 lineP1-lineP2 的最短距离,返回没有 sqrt 的值
func MinDistanceSqrBetweenPointAndLineSegment(p0 []float64, lineP1, lineP2 []float64) float64 {
    l2 := dist2(lineP1, lineP2)
    if l2 == 0 {
        return dist2(p0, lineP1)
    }
    t := ((p0[0]-lineP1[0])*(lineP2[0]-lineP1[0]) + (p0[1]-lineP1[1])*(lineP2[1]-lineP1[1])) / l2
    if t >= 1 {
        t = 1
    }
    if t < 0 {
        t = 0
    }
    px := []float64{lineP1[0] + t*(lineP2[0]-lineP1[0]), lineP1[1] + t*(lineP2[1]-lineP1[1])}
    return dist2(p0, px)
}
矩形距离
有了上面代码,再计算两矩形间距离就容易了,流程如下:
- 对矩形的 4 条边,两两判断是否相交,如果任何边有相交情况,则矩形距离为 0,直接返回。
- 计算矩形 1 的四个顶点,到矩形 2 四条边的距离,得到 4×4 = 16 个值。
- 计算矩形 2 的四个顶点,到矩形 1 四条边的距离,得到 4×4 = 16 个值。
- 上面两个步骤加起来 32 个值中,取最小值为矩形间距离,返回。
实现代码如下:
import "math"

// MinDistanceSqrBetweenRectangle 返回两个矩形之间的最小距离值,返回没有 sqrt 的值
// 矩形中的点需要是顺时针排序好的
func MinDistanceSqrBetweenRectangle(rect1, rect2 [][]float64) float64 {
    if len(rect1) != 4 || len(rect2) != 4 {
        return 0
    }
    // find out if any segment from the first rectangle intersects with any segment from the second rectangle.
    for i := 1; i < 4; i++ {
        for j := 1; j < 4; j++ {
            interset := IsLineSegmentIntersect(rect1[i-1], rect1[i], rect2[j-1], rect2[j])
            if interset {
                return 0
            }
        }
    }
    // For every corner point from the first rectangle find distances to all segments from the second rectangle
    minDistance := math.MaxFloat64
    for i := range rect1 {
        for j := 1; j < 4; j++ {
            dist := MinDistanceSqrBetweenPointAndLineSegment(rect1[i], rect2[j-1], rect2[j])
            if dist < minDistance {
                minDistance = dist
            }
        }
    }
    for i := range rect2 {
        for j := 1; j < 4; j++ {
            dist := MinDistanceSqrBetweenPointAndLineSegment(rect2[i], rect1[j-1], rect1[j])
            if dist < minDistance {
                minDistance = dist
            }
        }
    }
    return minDistance
}
代码实现 DBSCAN
最后我们来通过 Go 语言实现 DBSCAN 算法,首先定义算法参数结构:
// DBSCANParameters describes the parameters of the density-based
// clustering algorithm DBSCAN
type DBSCANParameters struct {
    // Eps represents the "reachability", or the maximum
    // distance any point can be before being considered for
    // inclusion.
    Eps float64

    // MinCount represents how many points need to be
    // in a cluster before it is considered one.
    MinCount int
}
对于矩形数组,事先计算好每两个矩形之间的距离,以供后面待查:
import (
    "gonum.org/v1/gonum/mat"
)

func computePairwiseDistances(rectArray [][][]float64) *mat.Dense {
    // Compute pair-wise distances
    // Do an n^2 computation of all pairwise distances
    rows := len(rectArray)
    dist := mat.NewDense(rows, rows, nil)
    for i := 0; i < rows; i++ {
        for j := i + 1; j < rows; j++ {
            d := MinDistanceSqrBetweenRectangle(rectArray[i], rectArray[j])
            dist.Set(i, j, d)
            dist.Set(j, i, d)
        }
    }
    return dist
}
实现算法的 regionQuery 函数:
// RegionQuery is simple way O(N) to find points in neighbourhood
// It is roughly equivalent to kdTree.InRange(points[i], eps, nil)
func regionQuery(dist *mat.Dense, p int, eps float64) []int {
    result := []int{}
    rows, _ := dist.Dims()
    // Return any points within the Eps neighbourhood
    for i := 0; i < rows; i++ {
        if dist.At(p, i) <= eps {
            result = append(result, i) // Mark as neighbour
        }
    }
    return result
}
最后 DBSCAN 主函数:
import (
    "math/big"
)

func DBSCAN(rectArray [][][]float64, params DBSCANParameters) (clusters map[int][]int, noise []int) {
    rows := len(rectArray)
    visited := make([]bool, rows)
    members := make([]bool, rows)
    clusters = make(map[int][]int)
    noise = []int{}
    c := 0

    dist := computePairwiseDistances(rectArray)

    for i := 0; i < rows; i++ {
        if visited[i] {
            continue
        }
        visited[i] = true

        neighborPts := regionQuery(dist, i, params.Eps)
        if len(neighborPts) < params.MinCount {
            noise = append(noise, i)
        } else {
            clusters = []int{i}
            members[i] = true

            // expandCluster goes here inline
            neighborUnique := big.NewInt(0)
            for j := 0; j < len(neighborPts); j++ {
                neighborUnique.SetBit(neighborUnique, neighborPts[j], 1)
            }

            for j := 0; j < len(neighborPts); j++ {
                k := neighborPts[j]
                if !visited[k] {
                    visited[k] = true
                    moreNeighbors := regionQuery(dist, k, params.Eps)
                    if len(moreNeighbors) >= params.MinCount {
                        for _, p := range moreNeighbors {
                            if neighborUnique.Bit(p) == 0 {
                                neighborPts = append(neighborPts, p)
                                neighborUnique.SetBit(neighborUnique, p, 1)
                            }
                        }
                    }
                    if !members[k] {
                        clusters = append(clusters, k)
                        members[k] = true
                    }
                }
            }

            c++
        }
    }
    return
}
算法效果
对于文章开头的测试数据,通过 DBSCAN 算法后,返回噪声点数据,我们将其用不同颜色画出来,如下图,效果还是比较明显的。
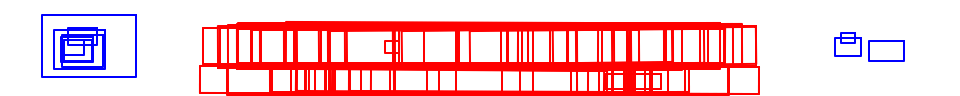
这里我选择的参数 eps = 5 ,minPts = 8。参数值的选择,可以根据我们数据分布情况灵活选择,参数选择不好,可能会影响最终效果。
参考资料:
- https://math.stackexchange.com/questions/3232521/shortest-distance-between-two-rectangles-in-2d
- https://en.wikipedia.org/wiki/DBSCAN
- https://en.wikipedia.org/wiki/Line%E2%80%93line_intersection
- https://stackoverflow.com/questions/849211/shortest-distance-between-a-point-and-a-line-segment